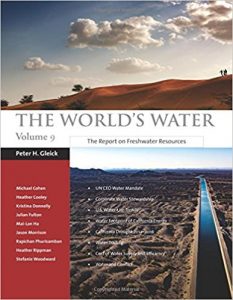
2018 The World’s Water (Volume 9)

The World’s Water, Volume 9, released February 2018, is the latest volume of the series that has delivered key data and expert insights into our most pressing freshwater issues for the past twenty years. The series has provided the most thoughtful and comprehensive coverage of the available knowledge and the analysis needed to deal with the challenges facing a sustainable, safe, equitable water supply for everyone. Alexandra Cousteau describes the series as “the single best resource for the public, researchers, and advocates working to protect the world’s freshwater resources.”
The new volume delivers analysis on corporate water stewardship, the human right to water and sanitation, water-use trends in the United States, the water footprint of California energy, the consequences of the severe five-year California drought, water markets and economic strategies for water management, and the cost of alternative water supply and demand strategies. Additionally, concise “water briefs” provide updates on water’s role in conflict around the globe, a meeting held at the Pontifical Academy of Sciences in the Vatican on the human right to water, and critical issues around public access to water through drinking fountains.
Chapters:
- The UN Global Compact CEO Water Mandate: History, Objectives, Strategy
- A Human Rights Lens for Corporate Water Stewardship: Toward Achievement of the Sustainable Development Goal for Water
- Updating Water-Use Trends in the United States
- The Water Footprint of California’s Energy System, 1990–2012
- The Nature and Impact of the 2012–2016 California Drought
- Water Trading in Theory and Practice
- The Cost of Water Supply and Efficiency Options: A California Case
Water Briefs:
- The Human Right to Water and Global Sustainability: Actions of the Vatican
- Access to Water through Public Drinking Fountains
- Water and Conflict Update
Pacific Institute President Emeritus Peter Gleick is the series creator and editor, with coauthors Michael Cohen, Heather Cooley, Kristina Donnelly, Julian Fulton, Mai-Lan Ha, Jason Morrison, Rapichan Phurisamban, Heather Rippman, and Stefanie Woodward. Foreword by Alexandra Cousteau.
The book is an invaluable resource for community leaders, health officials, academics, students, and others whose work touches on freshwater.
Purchase the eBook for $12.99:
The World’s Water Volume 9 is also available in the following formats:
As a print-on-demand softcover book for $55.00.
As a Kindle ebook for $9.99.
Previous volumes of The World’s Water are available here.
View selected chapters and data tables from previous editions of The World’sWater here.
Media highlights from previous volumes:
Peter Gleick discusses: Peak Water, Population and Sustainable Water, Climate Change and the Water Cycle
Watch Peter Gleick’s 2011 presentation at the Woodrow Wilson Center:
Listen to Peter Gleick talk about potential risks from coal seam gas mining.
Read EOS Magazine article on The World’s Water: “Meeting Basic Human Needs for Water Presents Huge Challenge, Expert Says.”

